Tuesday, December 27, 2011

Fed Loan Data Part 1

This is the start of analyzing the Federal Reserve and Banking data mentioned in my "A Christmas Miracle". The file is a combination of summary data and actual data from each of the 400+ banks that recieved funds from the Federal Reserve during 2007-2009.

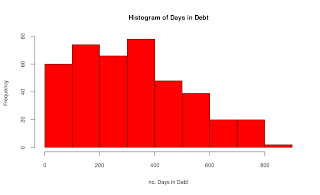
Like so many data sets there are some data clean up challenges. The first is the use of excel, which is not a problem, but the authors decided to add considerable headers, and unusual formats to the summary tables. Here is my attempt to get one of the first data files cleaned up and working. One big problem is changing $1,000.00 into 1000.00, I have some code below, but would appreciate any help in making my code better. Below are the summary graphs of the data:


The basic graphs are pretty self explanatory, for fun I did a regression to see if there is any correlation, the first regression was okay, but i noticed it could use a semi-log transformation. After taking the log of the average daily balance, i got a much better looking regression as well as r^2.


Below is my R code:


#Fed Data
library(stringr)
fed.01<-read.csv(file.choose(), header=T)
summary(fed.01)
 
#Cleaning up the Data- removed the $ sign and the ',' in 1,000
average<-str_sub(fed.01$Average.Daily.Balance..in.Millions.of.U.S..Dollars.,
                 start=2, end=-1)
average<-as.numeric(gsub(",", '', average))
fed.02<-cbind(average, fed.01)
 
#Exploritory Graphs
hist(fed.02$Days.in.Debt, main='Histogram of Days in Debt',
     col='red', xlab='no. Days in Debt')
years.debt<-fed.02$Days.in.Debt/365
hist(years.debt, main='Histogram of Years in Debt', col='red',
     xlab='no. Years in Debt', breaks=15)
 
#Bar graphs the the data
#The country of origin
par(las=2, mar=c(5,12,4,2), mfrow=c(1,1))
country<-sort(table(fed.01$Country))
barplot(country, main='Nation of Banks', col='blue', horiz=TRUE)
 
#Type of Bank or Industry
par(las=2, mar=c(5,17,4,2), mfrow=c(1,1))
industry<-sort(table(fed.01$Industry))
barplot(industry, main='Type of Industry',
        col='blue', horiz=TRUE)
 
#Organizations with average balances greater than $5 billion
five.bill<-subset(fed.02, average>5000)
par(las=2, mar=c(5,19,4,2), mfrow=c(1,1))
barplot(sort(five.bill$average),names.arg=five.bill$Company,
        main='Companies With Average Daily Balance Greater
        than $5 Billion', col='blue', hor=TRUE)
 
 
#Organizations with debt more then 730 days (2 years)
year.comp<-subset(fed.02, Days.in.Debt>730)
par(las=1, mar=c(5,20,4,2))
barplot(sort(year.comp$Days.in.Debt),
        names.arg=year.comp$Company,
        main='Companies With Days of Debt Greater
        than 730 Days (2 Years)
        days', col='red', hor=TRUE, xpd=FALSE, 
        xlim=c(720, 830))
par(las=0, mar=c(5,4,4,2))
 
#Regression of Days in Debt to Ave. Daily Balance
 
#ploted the data, the r2 is poor, and the slop is positive, 
#nothing to get too excited about, took the log
plot(fed.02$Days.in.Debt, fed.02$average, xlab='Days in Debt',
     ylab='Ave. Daily Balance', main='Scatter Plot:
     Daily Balance and Days in Debt')
lm.01<-lm(fed.02$average~fed.02$Days.in.Debt)
abline(lm.01)
summary(lm.01)
 
#log of fed$average to reduce the outliers
log.aver<-log(fed.02$average)
plot(fed.02$Days.in.Debt, log.aver, xlab='Days in Debt',
     ylab='Log of Ave. Daily Balance', main='Scatter Plot:
     Log Daily Balance and Days in Debt')
lm.02<-lm(log.aver~fed.02$Days.in.Debt)
abline(lm.02)
summary(lm.02)
Created by Pretty R at inside-R.org

Friday, December 23, 2011

A Christmas Miracle

Data files on 407 banks, between the dates of 2007 to 2009, on the daily borrowing with the US Federal Reserve bank. The data sets are available from Bloomberg at this address data 

This is an unprecedented look into the day-to-day transactions of banks with the Feds during one of the worse and unusual times in US financial history. A time of weekend deals, large banks being summoned to sign contracts, and all around chaos. For the economist, technocrat, and R enthusiasts this is the opportunity of a life time to examine and analyze financial data normally held in the strictest of confidentiality. A good comparison would be taking all of the auto companies and getting their daily production, sales, and cost data for two years and sending it out to the world. Never has happened.

Thank you Bloomberg for making it available and Drudgereport.com for the link to it.

Wednesday, August 3, 2011

Tomboy Notes: Personal R Help File

When learning R it is helpful to have your own personal help file. One you create for yourself, with the notes, links, and language you understand (sometimes the help files are not very helpful). Let me introduce you to Tomboy Notes.

Tomboy Notes is a light weight and simple note taking program that will work on Windows, Mac and Linux ( to download use: http://projects.gnome.org/tomboy/download.html). There are two features I would like to highlight, the notebook and the link system.

The notebook allows the user to combine and organize the separate little notes into one area or file, while still retaining their individuality. Opening Tomboy Notes for the first time there is a blank post-it-note looking screen with a a couple of buttons on top. Yep it is that simple. Start writing text and the note will be saved automatically and a list of notes will begin to form. As the number of little notes grows there will arise the need to organize them.

This is done in the main page under file- Notebooks- New Notebook. Once a notebook is made a simple click of the file will show the notes in that particular notebook. Also if some of the notes are needed in several notebooks, that is okay, they can be used in as many notebooks as desired. This is a great way of organizing and keeping track of various notes within the program.

The next feature is the link. Linking button, with a little arrow pointing down, takes a word or phrase, then creates a new note. This note has the title of the word/phrase just highlighted, with the additional comments added by the user. The nice thing about Tomboy Notes is when a link is made, any time that word is used (past or future) that word now links up to that note.

For example when looking up the plot function I went to my R-Code notebook (large window), opened the plot note (medium, top-right), then I had a question about xlim, I click on the blue link and a description of the xlim function is given (small, bottom-right). All of this was done with 3 clicks of the mouse.


Anytime I insert any bit of code from R-Blogger I past it here to see what code I do not have a note about (not blue). This way I can focus on code I do not know. If I do have the code but there is a new twist, I can edit the link to add the additional information and all the links are updated. Tomboy Notes is a convenient and simple way of managing and organizing the vast amount of code available in R, in a personal way. Every time I get a new set of code I paste it into R-Studio to play with it, and Tomyboy Notes,. With each new set of code my own help file expands and so to my understanding of R. And in case I forget, I can go back and find it.

Monday, June 20, 2011

Statistics.com Review

Disclaimer: All prices and classes are approximate and should be confirmed at www.statistics.com as they can change.

A comment from my previous post asked me about the experience I had in taking courses from statistics.com (www.statistics.com). To help understand how I am critiquing the courses I took, I have been teaching myself R for the past 2-3 years, and I was doing fine, but I was growing frustrated at the lack of accomplishment and growth. The straw that broke the camel's back came when I spent 3 hours trying to figure out the mar() function in graphs.

Thankfully I looked on the R-blogger site and found an example and was able to do what I wanted. Nevertheless, I come to a crossroads of sorts and I needed some help. I had found the site before and had looked into the courses. I wanted to play it safe so I took one of the introductory courses at first to see if I liked it and then I took several others. My purpose was to improve my R skill to the point where I could be a contributing member of the R community as well as figure out code without spending an entire afternoon.

Should someone take classes from statistics.com?

If you are a beginner, or even an intermediate to advance user looking to improve on particular area or skill set....YES

Pros:

1. Excellent instructors- often times the instructors for these courses are the actual writers of the code, or book, or package. For example the instructor for the graphics class is Paul Murrell the author of the textbook used.

2. Good format- the 4 week format is intense but efficient. These are get in and learn fast classes, they are not going to cover all the possible topics (they just can't), but they will cover many of the most important. For example in the statistics class we covered many of the primary tests used in statistics. Did we cover all of them...no, but we did get a flavor and understanding of the primary, which will allow students to go out and figure out the rest.

3. Good price- the price was reasonable for the course (see the website for actual pricing), about $300-$400 per class. I found this reasonable and affordable considering the instructors were such high caliber.

Side note here, I just took the R classes, I did not get a certification which requires a series of classes and are much more expensive as they are like getting an MBA then going back taking a few extra classes to get a certificate in HR. There is some confusion in that each class gives a certificate of accomplishment for each completed class, but for those taking just the R courses they are just saying you completed the course.

4. Textbooks- the textbooks were affordable when required, of the 4 course I took I only needed textbooks for two of the courses, the rest had on-line materials. For the courses with a textbook the books were ~$80 for the R Graphics (Murrell, Paul) and ~$50 for Using R for Introductory Statistics (Verzani, John). Compared to the cost of other R books and especially textbooks this is not a bad price.

5. Good examples- for the most part the courses gave excellent lessons, with good examples, where the student could accomplish the assignments, while still being challenged.

Cons:

1. Not enough time to dive into some of the more interesting topics. The balance between time and cost is always in question, and for the price there is a good balance, I just wish to have more time to ask more questions and to really understand the material better.

2. 1 week for each assignment- There were several times through the course where I wanted to have more time, or to work a head on the assignments. The problem was the assignments would show up on a Friday ad would be due 10 days later on a Sunday. I see no reason why they cannot have the due dates stay the same, while allowing all the assignments to be open from the beginning.

Overall I am impressed by the courses and would recommend them to any R programmer who wants to develop or enhance their skills.

Below is a list of various classes available for those who want with the website.

* Clinical Trials - R
* Data Mining - R
* Microarray Analysis
* R Graphics
* R Intro (data)
* R Intro (stats)
* R Modeling
* R Programming Advanced
* R Programming
* R ggplot2
* SVM in R
* Spatial Analysis in R

http://www.statistics.com/course-catalog/

Thursday, May 26, 2011

Beginne..R 1.0

Opening this blog is a step in a long journey of discovery, learning and frustration. To begin with I would consider myself a beginner R user, I am getting better, but I am not about to write a package any time soon. I started using R about three years ago, when I made the switch to Linux (PCLinux at first then Mint). As part of my professional/personal development I was searching for open source programs to do statistics and calculus with and when i began searching through the package repositories I saw R and RKWard, I began playing around and started getting interested. I got a copy of "The R Book" and I was hooked.

I look around at others who are doing such cool things with R and I am in awe of their skills. I am getting better, but getting the skills I need has been a long and frustrating process. First, I am not a programmer, I have played around with HTML and JavaScript, but that was over ten years ago, so this is the first programming language I have really dived into. The second frustration is the lack of a mentor or a teacher of some kind. While many students are given instruction on how to do use R I was learning on my own with books, websites and other resources available. A few months ago I would have never even thought about posting a blog, but I have turned a corner to where I am able to participate in the R conversation.

What has made this possible are the courses found on statistics.com and the Finance and R Conference in Chicago. I was getting better and at the same time more frustrated with R when I found the R courses on statistics.com. I tried a course and really enjoyed it, the four week set up and use of Moodle learning management system makes the experience enjoyable. The price is reasonable and the instructors are great, for anybody trying to learn R on their own, I highly recommend taking a few courses from statistics.com as it fills in the gaps and pushes you into areas, and packages you probably would have not done on your own. The courses in statistics.com filled in the gap, the motivation came from the Financial R Conference.

The Financial Conference in Chicago was my first experience with so many people using R and interacting with them. I will post a more through review of the conference as soon as they post the presentations so I can reference them. I like to think of my experience at the R conference like a runner at their first race. First there is a buzz of excitement and energy at the conference as like minded individuals meet and share ideas. Then there are the presentations, the race. Like running a race for the first time I did not have any idea what to expect, I did my best to prepare, but I was not ready, or in the case of the runner, I finished dead last, but I finished.

Finishing last is okay, as the saying goes, "You learn most when you loose." I learned where my weaknesses and strengths are. I came back energized and excited. I am now ready to dive into the conversation of R and all the many facets it has. I look forward to the comments ad feedback from others as I post some of the more interesting and fun things that R can do.